Bayesian regularized linear models via Stan
Source:R/stan_aov.R, R/stan_lm.R, R/stan_lm.fit.R
stan_lm.Rd
Bayesian inference for linear modeling with regularizing priors on the model
parameters that are driven by prior beliefs about \(R^2\), the proportion
of variance in the outcome attributable to the predictors. See
priors for an explanation of this critical point.
stan_glm with family="gaussian" also estimates a linear
model with normally-distributed errors and allows for various other priors on
the coefficients.
Usage
stan_aov(
  formula,
  data,
  projections = FALSE,
  contrasts = NULL,
  ...,
  prior = R2(stop("'location' must be specified")),
  prior_PD = FALSE,
  algorithm = c("sampling", "meanfield", "fullrank"),
  adapt_delta = NULL
)

stan_lm(
  formula,
  data,
  subset,
  weights,
  na.action,
  model = TRUE,
  x = FALSE,
  y = FALSE,
  singular.ok = TRUE,
  contrasts = NULL,
  offset,
  ...,
  prior = R2(stop("'location' must be specified")),
  prior_intercept = NULL,
  prior_PD = FALSE,
  algorithm = c("sampling", "meanfield", "fullrank"),
  adapt_delta = NULL
)

stan_lm.wfit(
  x,
  y,
  w,
  offset = NULL,
  singular.ok = TRUE,
  ...,
  prior = R2(stop("'location' must be specified")),
  prior_intercept = NULL,
  prior_PD = FALSE,
  algorithm = c("sampling", "meanfield", "fullrank"),
  adapt_delta = NULL
)

stan_lm.fit(
  x,
  y,
  offset = NULL,
  singular.ok = TRUE,
  ...,
  prior = R2(stop("'location' must be specified")),
  prior_intercept = NULL,
  prior_PD = FALSE,
  algorithm = c("sampling", "meanfield", "fullrank"),
  adapt_delta = NULL
)
Arguments
- formula, data, subset
Same as
lm, but we strongly advise against omitting thedataargument. Unlessdatais specified (and is a data frame) many post-estimation functions (includingupdate,loo,kfold) are not guaranteed to work properly.- projections
For
stan_aov, a logical scalar (defaulting toFALSE) indicating whetherprojshould be called on the fit.- ...
Further arguments passed to the function in the rstan package (
sampling,vb, oroptimizing), corresponding to the estimation method named byalgorithm. For example, ifalgorithmis"sampling"it is possible to specifyiter,chains,cores, and other MCMC controls.Another useful argument that can be passed to rstan via
...isrefresh, which specifies how often to print updates when sampling (i.e., show the progress everyrefreshiterations).refresh=0turns off the iteration updates.- prior
Must be a call to
R2with itslocationargument specified orNULL, which would indicate a standard uniform prior for the \(R^2\).- prior_PD
A logical scalar (defaulting to
FALSE) indicating whether to draw from the prior predictive distribution instead of conditioning on the outcome.- algorithm
A string (possibly abbreviated) indicating the estimation approach to use. Can be
"sampling"for MCMC (the default),"optimizing"for optimization,"meanfield"for variational inference with independent normal distributions, or"fullrank"for variational inference with a multivariate normal distribution. Seerstanarm-packagefor more details on the estimation algorithms. NOTE: not all fitting functions support all four algorithms.- adapt_delta
Only relevant if
algorithm="sampling". See the adapt_delta help page for details.- na.action, singular.ok, contrasts
Same as
lm, but rarely specified.- model, offset, weights
Same as
lm, but rarely specified.- x, y
In
stan_lm, stan_aov, logical scalars indicating whether to return the design matrix and response vector. Instan_lm.fit or stan_lm.wfit, a design matrix and response vector.- prior_intercept
Either
NULL(the default) or a call tonormal. If anormalprior is specified without ascale, then the standard deviation is taken to be the marginal standard deviation of the outcome divided by the square root of the sample size, which is legitimate because the marginal standard deviation of the outcome is a primitive parameter being estimated.Note: If using a dense representation of the design matrix —i.e., if the
sparseargument is left at its default value ofFALSE— then the prior distribution for the intercept is set so it applies to the value when all predictors are centered. If you prefer to specify a prior on the intercept without the predictors being auto-centered, then you have to omit the intercept from theformulaand include a column of ones as a predictor, in which case some element ofpriorspecifies the prior on it, rather thanprior_intercept. Regardless of howprior_interceptis specified, the reported estimates of the intercept always correspond to a parameterization without centered predictors (i.e., same as inglm).- w
Same as in
lm.wfitbut rarely specified.
Value
A stanreg object is returned
for stan_lm, stan_aov.
A stanfit object (or a slightly modified
stanfit object) is returned if stan_lm.fit or stan_lm.wfit is called directly.
Details
The stan_lm function is similar in syntax to the
lm function but rather than choosing the parameters to
minimize the sum of squared residuals, samples from the posterior
distribution are drawn using MCMC (if algorithm is
"sampling"). The stan_lm function has a formula-based
interface and would usually be called by users but the stan_lm.fit
and stan_lm.wfit functions might be called by other functions that
parse the data themselves and are analogous to lm.fit
and lm.wfit respectively.
In addition to estimating sigma — the standard deviation of the
normally-distributed errors — this model estimates a positive parameter
called log-fit_ratio. If it is positive, the marginal posterior
variance of the outcome will exceed the sample variance of the outcome
by a multiplicative factor equal to the square of fit_ratio.
Conversely if log-fit_ratio is negative, then the model underfits.
Given the regularizing nature of the priors, a slight underfit is good.
Finally, the posterior predictive distribution is generated with the predictors fixed at their sample means. This quantity is useful for checking convergence because it is reasonably normally distributed and a function of all the parameters in the model.
The stan_aov function is similar to aov, but
does a Bayesian analysis of variance that is basically equivalent to
stan_lm with dummy variables. stan_aov has a somewhat
customized print method that prints an ANOVA-like table in
addition to the output printed for stan_lm models.
References
Lewandowski, D., Kurowicka D., and Joe, H. (2009). Generating random correlation matrices based on vines and extended onion method. Journal of Multivariate Analysis. 100(9), 1989–2001.
See also
The vignettes for stan_lm and stan_aov, which have more
thorough descriptions and examples.
https://mc-stan.org/rstanarm/articles/
Also see stan_glm, which — if family =
gaussian(link="identity") — also estimates a linear model with
normally-distributed errors but specifies different priors.
Examples
if (.Platform$OS.type != "windows" || .Platform$r_arch != "i386") {
# \donttest{
op <- options(contrasts = c("contr.helmert", "contr.poly"))
fit_aov <- stan_aov(yield ~ block + N*P*K, data = npk,
prior = R2(0.5), seed = 12345)
options(op)
print(fit_aov)
# }
}
#>
#> SAMPLING FOR MODEL 'lm' NOW (CHAIN 1).
#> Chain 1:
#> Chain 1: Gradient evaluation took 1.6e-05 seconds
#> Chain 1: 1000 transitions using 10 leapfrog steps per transition would take 0.16 seconds.
#> Chain 1: Adjust your expectations accordingly!
#> Chain 1:
#> Chain 1:
#> Chain 1: Iteration: 1 / 2000 [ 0%] (Warmup)
#> Chain 1: Iteration: 200 / 2000 [ 10%] (Warmup)
#> Chain 1: Iteration: 400 / 2000 [ 20%] (Warmup)
#> Chain 1: Iteration: 600 / 2000 [ 30%] (Warmup)
#> Chain 1: Iteration: 800 / 2000 [ 40%] (Warmup)
#> Chain 1: Iteration: 1000 / 2000 [ 50%] (Warmup)
#> Chain 1: Iteration: 1001 / 2000 [ 50%] (Sampling)
#> Chain 1: Iteration: 1200 / 2000 [ 60%] (Sampling)
#> Chain 1: Iteration: 1400 / 2000 [ 70%] (Sampling)
#> Chain 1: Iteration: 1600 / 2000 [ 80%] (Sampling)
#> Chain 1: Iteration: 1800 / 2000 [ 90%] (Sampling)
#> Chain 1: Iteration: 2000 / 2000 [100%] (Sampling)
#> Chain 1:
#> Chain 1: Elapsed Time: 0.092 seconds (Warm-up)
#> Chain 1: 0.074 seconds (Sampling)
#> Chain 1: 0.166 seconds (Total)
#> Chain 1:
#>
#> SAMPLING FOR MODEL 'lm' NOW (CHAIN 2).
#> Chain 2:
#> Chain 2: Gradient evaluation took 9e-06 seconds
#> Chain 2: 1000 transitions using 10 leapfrog steps per transition would take 0.09 seconds.
#> Chain 2: Adjust your expectations accordingly!
#> Chain 2:
#> Chain 2:
#> Chain 2: Iteration: 1 / 2000 [ 0%] (Warmup)
#> Chain 2: Iteration: 200 / 2000 [ 10%] (Warmup)
#> Chain 2: Iteration: 400 / 2000 [ 20%] (Warmup)
#> Chain 2: Iteration: 600 / 2000 [ 30%] (Warmup)
#> Chain 2: Iteration: 800 / 2000 [ 40%] (Warmup)
#> Chain 2: Iteration: 1000 / 2000 [ 50%] (Warmup)
#> Chain 2: Iteration: 1001 / 2000 [ 50%] (Sampling)
#> Chain 2: Iteration: 1200 / 2000 [ 60%] (Sampling)
#> Chain 2: Iteration: 1400 / 2000 [ 70%] (Sampling)
#> Chain 2: Iteration: 1600 / 2000 [ 80%] (Sampling)
#> Chain 2: Iteration: 1800 / 2000 [ 90%] (Sampling)
#> Chain 2: Iteration: 2000 / 2000 [100%] (Sampling)
#> Chain 2:
#> Chain 2: Elapsed Time: 0.106 seconds (Warm-up)
#> Chain 2: 0.07 seconds (Sampling)
#> Chain 2: 0.176 seconds (Total)
#> Chain 2:
#>
#> SAMPLING FOR MODEL 'lm' NOW (CHAIN 3).
#> Chain 3:
#> Chain 3: Gradient evaluation took 9e-06 seconds
#> Chain 3: 1000 transitions using 10 leapfrog steps per transition would take 0.09 seconds.
#> Chain 3: Adjust your expectations accordingly!
#> Chain 3:
#> Chain 3:
#> Chain 3: Iteration: 1 / 2000 [ 0%] (Warmup)
#> Chain 3: Iteration: 200 / 2000 [ 10%] (Warmup)
#> Chain 3: Iteration: 400 / 2000 [ 20%] (Warmup)
#> Chain 3: Iteration: 600 / 2000 [ 30%] (Warmup)
#> Chain 3: Iteration: 800 / 2000 [ 40%] (Warmup)
#> Chain 3: Iteration: 1000 / 2000 [ 50%] (Warmup)
#> Chain 3: Iteration: 1001 / 2000 [ 50%] (Sampling)
#> Chain 3: Iteration: 1200 / 2000 [ 60%] (Sampling)
#> Chain 3: Iteration: 1400 / 2000 [ 70%] (Sampling)
#> Chain 3: Iteration: 1600 / 2000 [ 80%] (Sampling)
#> Chain 3: Iteration: 1800 / 2000 [ 90%] (Sampling)
#> Chain 3: Iteration: 2000 / 2000 [100%] (Sampling)
#> Chain 3:
#> Chain 3: Elapsed Time: 0.099 seconds (Warm-up)
#> Chain 3: 0.1 seconds (Sampling)
#> Chain 3: 0.199 seconds (Total)
#> Chain 3:
#>
#> SAMPLING FOR MODEL 'lm' NOW (CHAIN 4).
#> Chain 4:
#> Chain 4: Gradient evaluation took 8e-06 seconds
#> Chain 4: 1000 transitions using 10 leapfrog steps per transition would take 0.08 seconds.
#> Chain 4: Adjust your expectations accordingly!
#> Chain 4:
#> Chain 4:
#> Chain 4: Iteration: 1 / 2000 [ 0%] (Warmup)
#> Chain 4: Iteration: 200 / 2000 [ 10%] (Warmup)
#> Chain 4: Iteration: 400 / 2000 [ 20%] (Warmup)
#> Chain 4: Iteration: 600 / 2000 [ 30%] (Warmup)
#> Chain 4: Iteration: 800 / 2000 [ 40%] (Warmup)
#> Chain 4: Iteration: 1000 / 2000 [ 50%] (Warmup)
#> Chain 4: Iteration: 1001 / 2000 [ 50%] (Sampling)
#> Chain 4: Iteration: 1200 / 2000 [ 60%] (Sampling)
#> Chain 4: Iteration: 1400 / 2000 [ 70%] (Sampling)
#> Chain 4: Iteration: 1600 / 2000 [ 80%] (Sampling)
#> Chain 4: Iteration: 1800 / 2000 [ 90%] (Sampling)
#> Chain 4: Iteration: 2000 / 2000 [100%] (Sampling)
#> Chain 4:
#> Chain 4: Elapsed Time: 0.106 seconds (Warm-up)
#> Chain 4: 0.101 seconds (Sampling)
#> Chain 4: 0.207 seconds (Total)
#> Chain 4:
#> stan_aov
#> family: gaussian [identity]
#> formula: yield ~ block + N * P * K
#> observations: 24
#> predictors: 12
#> ------
#> Median MAD_SD
#> (Intercept) 54.9 0.8
#> block1 1.2 1.3
#> block2 1.2 0.7
#> block3 -1.3 0.5
#> block4 -0.7 0.4
#> block5 0.2 0.3
#> N1 2.0 0.7
#> P1 -0.4 0.7
#> K1 -1.4 0.7
#> N1:P1 -0.6 0.7
#> N1:K1 -0.8 0.7
#> P1:K1 0.1 0.7
#>
#> Auxiliary parameter(s):
#> Median MAD_SD
#> R2 0.5 0.1
#> log-fit_ratio 0.0 0.1
#> sigma 4.2 0.7
#>
#> ANOVA-like table:
#> Median MAD_SD
#> Mean Sq block 43.8 20.9
#> Mean Sq N 48.6 26.7
#> Mean Sq P 13.7 11.0
#> Mean Sq K 29.5 19.6
#> Mean Sq N:P 12.0 16.0
#> Mean Sq N:K 17.6 23.0
#> Mean Sq P:K 5.5 7.6
#>
#> ------
#> * For help interpreting the printed output see ?print.stanreg
#> * For info on the priors used see ?prior_summary.stanreg
if (.Platform$OS.type != "windows" || .Platform$r_arch !="i386") {
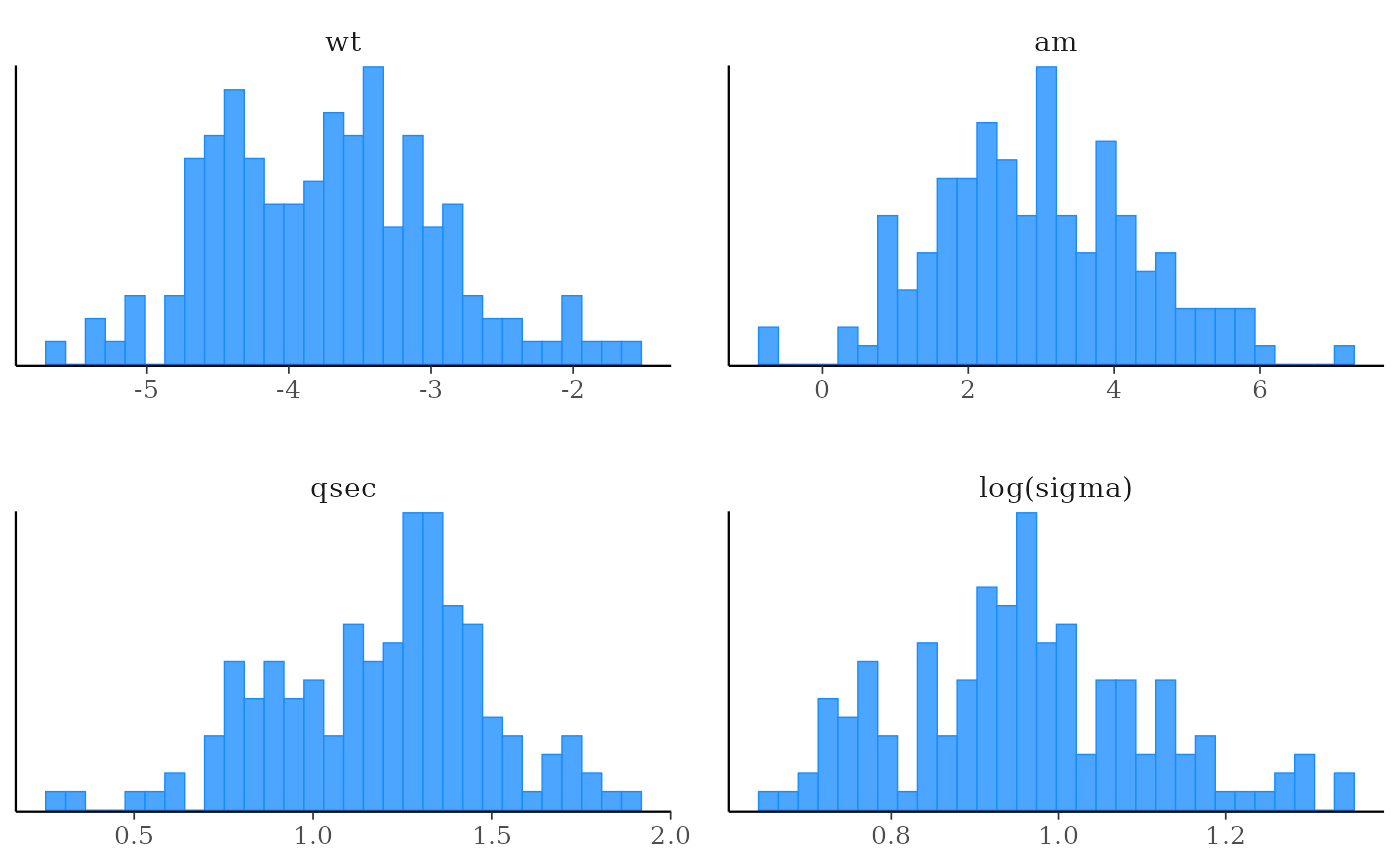
(fit <- stan_lm(mpg ~ wt + qsec + am, data = mtcars, prior = R2(0.75),
# the next line is only to make the example go fast enough
chains = 1, iter = 300, seed = 12345, refresh = 0))
plot(fit, "hist", pars = c("wt", "am", "qsec", "sigma"),
transformations = list(sigma = "log"))
}
#> Warning: The largest R-hat is 1.09, indicating chains have not mixed.
#> Running the chains for more iterations may help. See
#> https://mc-stan.org/misc/warnings.html#r-hat
#> Warning: Bulk Effective Samples Size (ESS) is too low, indicating posterior means and medians may be unreliable.
#> Running the chains for more iterations may help. See
#> https://mc-stan.org/misc/warnings.html#bulk-ess
#> Warning: Tail Effective Samples Size (ESS) is too low, indicating posterior variances and tail quantiles may be unreliable.
#> Running the chains for more iterations may help. See
#> https://mc-stan.org/misc/warnings.html#tail-ess
#> Warning: Markov chains did not converge! Do not analyze results!
#> `stat_bin()` using `bins = 30`. Pick better value `binwidth`.