The theme_default() function returns the default ggplot
theme used by the bayesplot plotting functions. See
bayesplot_theme_set() for details on setting and updating the plotting
theme.
Arguments
- base_size, base_family
Base font size and family (passed to
ggplot2::theme_bw()). It is possible to set"bayesplot.base_size"and"bayesplot.base_family"viaoptions()to change the defaults, which are12and"serif", respectively.
Value
A ggplot theme object.
See also
bayesplot_theme_set() to change the ggplot theme.
bayesplot-colors to set or view the color scheme used for plotting.
bayesplot-helpers for a variety of convenience functions, many of which provide shortcuts for tweaking theme elements after creating a plot.
Examples
class(theme_default())
#> [1] "theme" "ggplot2::theme" "gg" "S7_object"
bayesplot_theme_set() # defaults to setting theme_default()
x <- example_mcmc_draws()
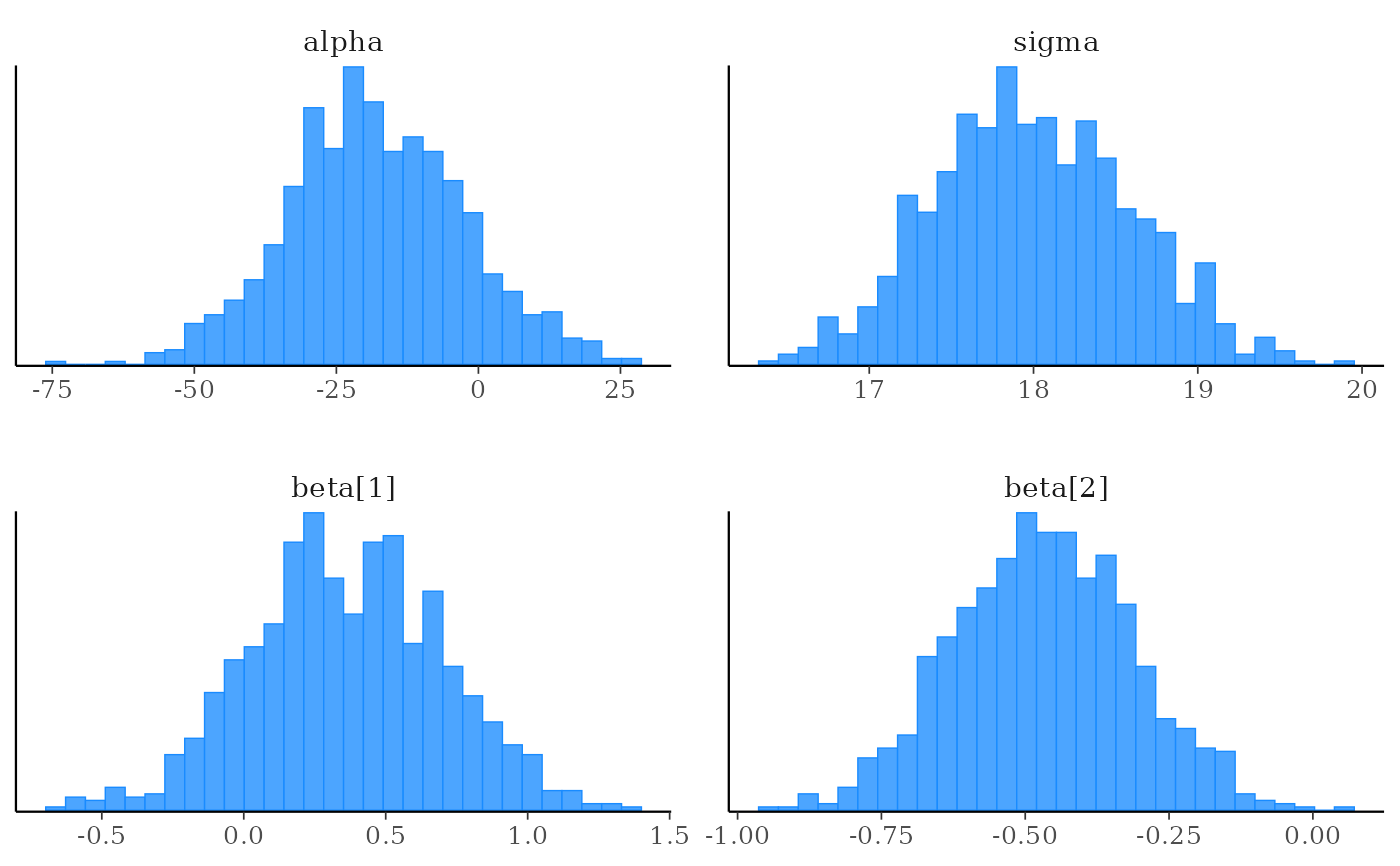
mcmc_hist(x)
#> `stat_bin()` using `bins = 30`. Pick better value `binwidth`.
 # change the default font size and family for bayesplots
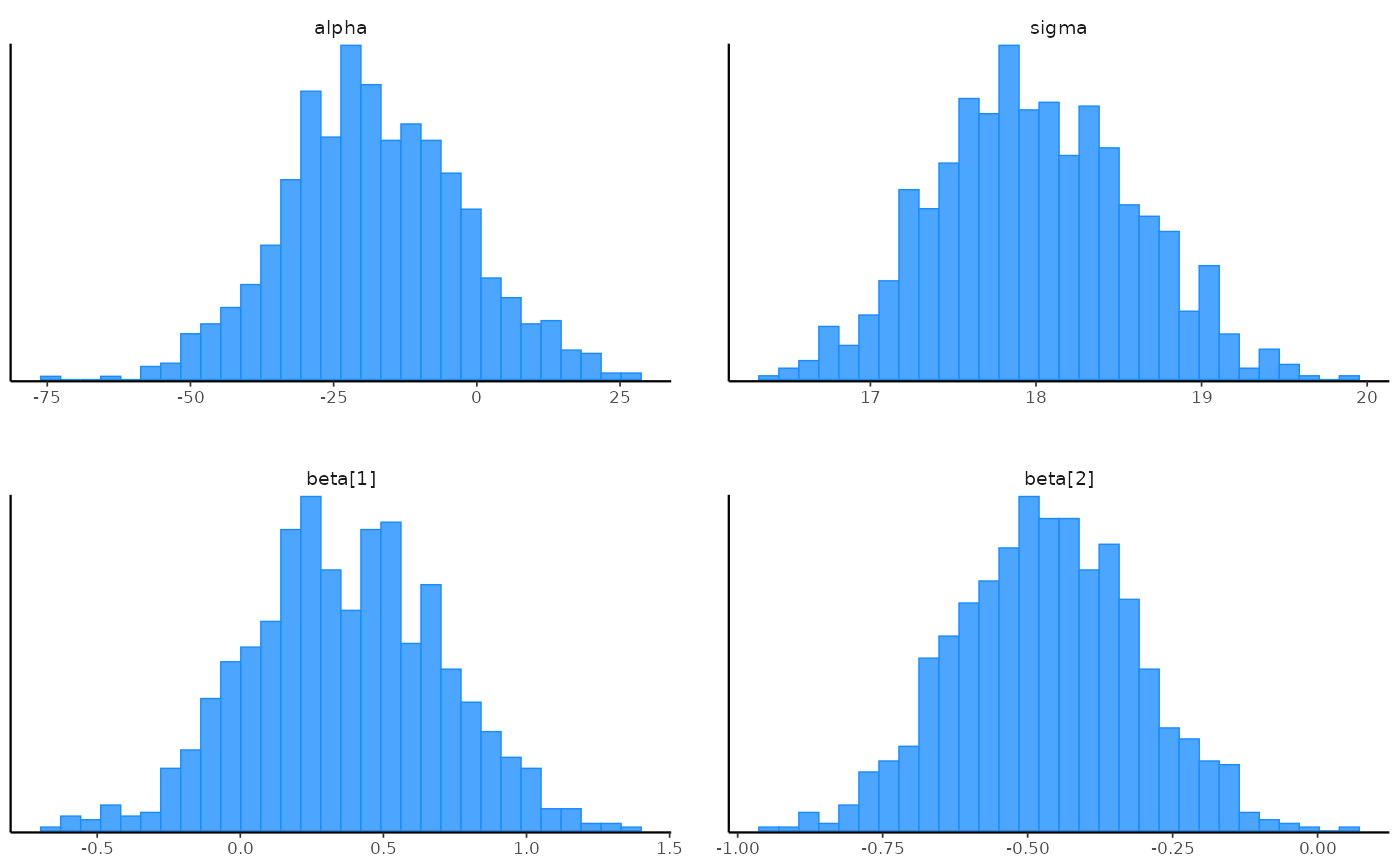
bayesplot_theme_set(theme_default(base_size = 8, base_family = "sans"))
mcmc_hist(x)
#> `stat_bin()` using `bins = 30`. Pick better value `binwidth`.
# change the default font size and family for bayesplots
bayesplot_theme_set(theme_default(base_size = 8, base_family = "sans"))
mcmc_hist(x)
#> `stat_bin()` using `bins = 30`. Pick better value `binwidth`.
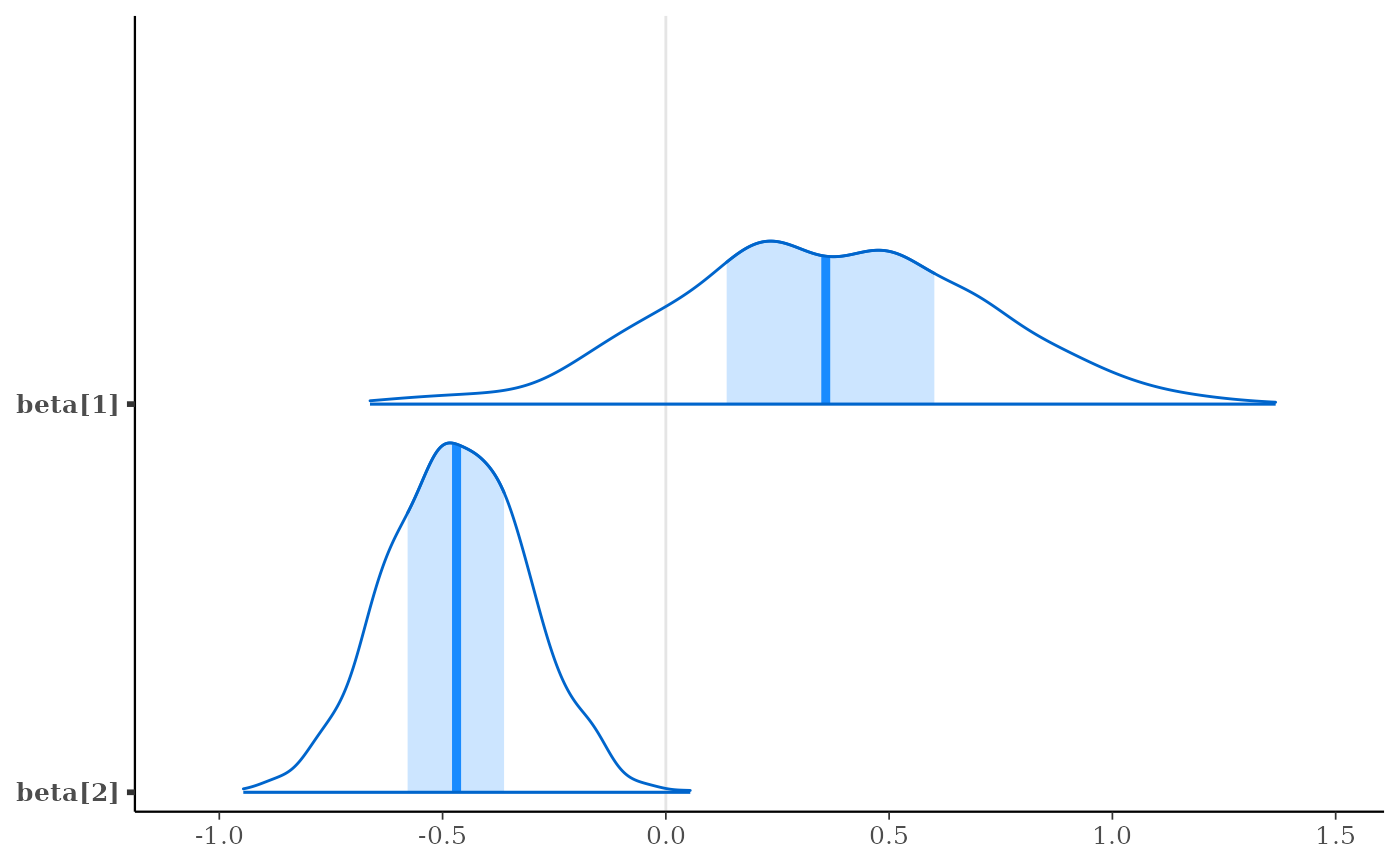
 mcmc_areas(x, regex_pars = "beta")
 # change back
bayesplot_theme_set()
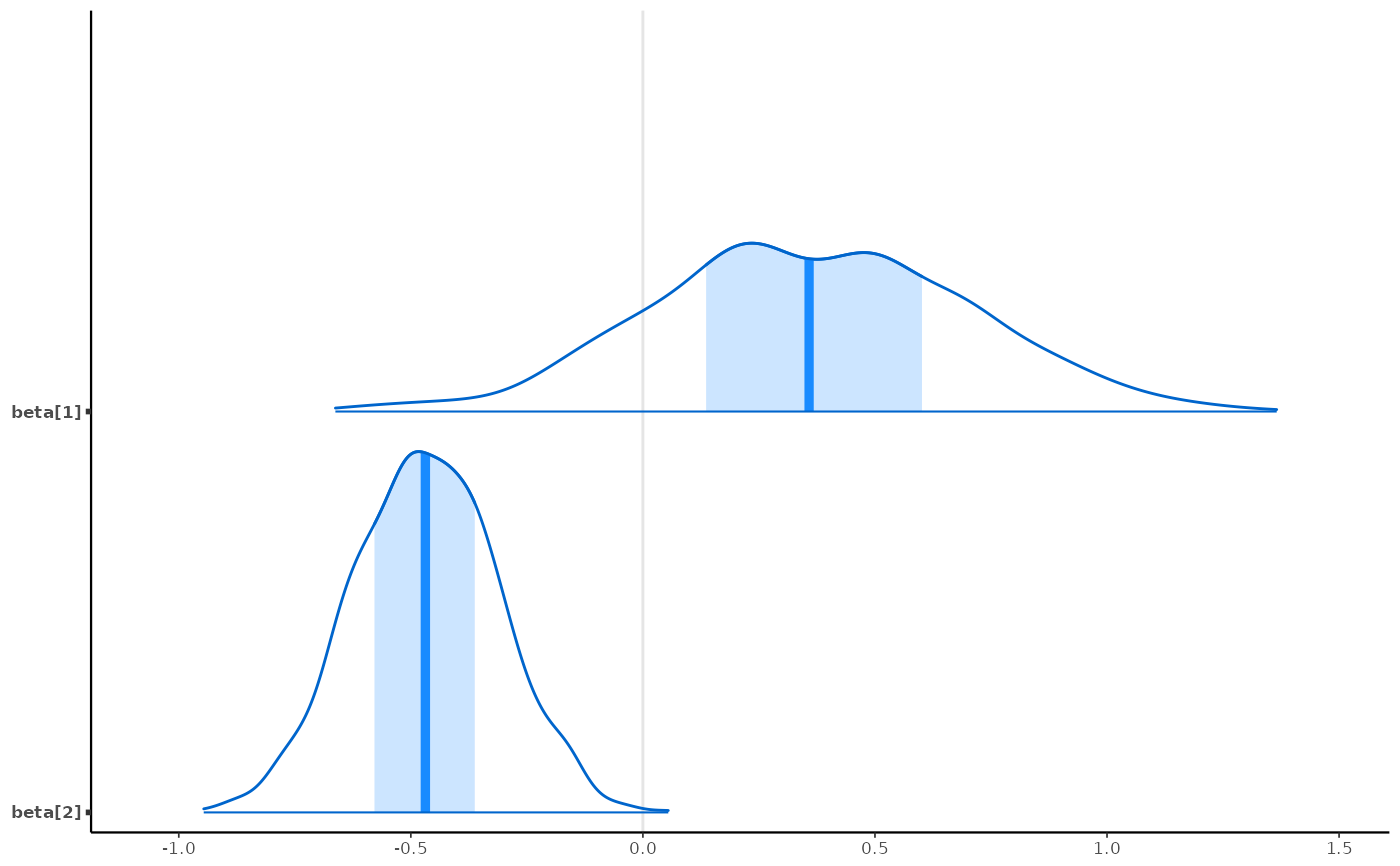
mcmc_areas(x, regex_pars = "beta")
# change back
bayesplot_theme_set()
mcmc_areas(x, regex_pars = "beta")